UHD / Office of the Provost / Office of Institutional Effectiveness / Office of Data Analytics & Institutional Research / Undergraduate Student Headcount Enrollment by Gender & Ethnicity
Undergraduate Student Headcount Enrollment by Gender & Ethnicity
*This page is best viewed in landscape mode
Female Male Overall Back to Fact Book Home
Female
| Ethnicity | Fall 2021 | Fall 2022 | Fall 2023 | Fall 2024 | Fall 2025 | % change from Previous Year |
|||||
|---|---|---|---|---|---|---|---|---|---|---|---|
| American Indian or Alaska Native | 8 | 0.1% | 6 | 0.1% | 7 | 0.1% | 6 | 0.1% | 6 | 0.1% | 0.0% |
| Asian | 523 | 6.0% | 499 | 6.2% | 503 | 6.3% | 490 | 6.2% | 441 | 5.8% | -10.0% |
| Black or African American | 1,710 | 19.8% | 1,540 | 19.0% | 1,469 | 18.5% | 1,451 | 18.5% | 1,428 | 18.6% | -1.6% |
| Hispanic/Latino | 5,054 | 58.4% | 4,845 | 59.9% | 4,827 | 60.7% | 4,814 | 61.3% | 4,679 | 61.0% | -2.8% |
| White | 945 | 10.9% | 822 | 10.2% | 777 | 9.8% | 706 | 9.0% | 622 | 8.1% | -11.9% |
| Native Hawaiian or Other Pacific Islander | 2 | 0.0% | 5 | 0.1% | 6 | 0.1% | 10 | 0.1% | 8 | 0.1% | -20.0% |
| Two or More Races | 217 | 2.5% | 184 | 2.3% | 187 | 2.3% | 179 | 2.3% | 185 | 2.4% | 3.4% |
| International | 151 | 1.7% | 147 | 1.8% | 120 | 1.5% | 117 | 1.5% | 121 | 1.6% | 3.4% |
| Race and ethnicity unknown | 45 | 0.5% | 42 | 0.5% | 62 | 0.8% | 76 | 1.0% | 175 | 2.3% | 130.3% |
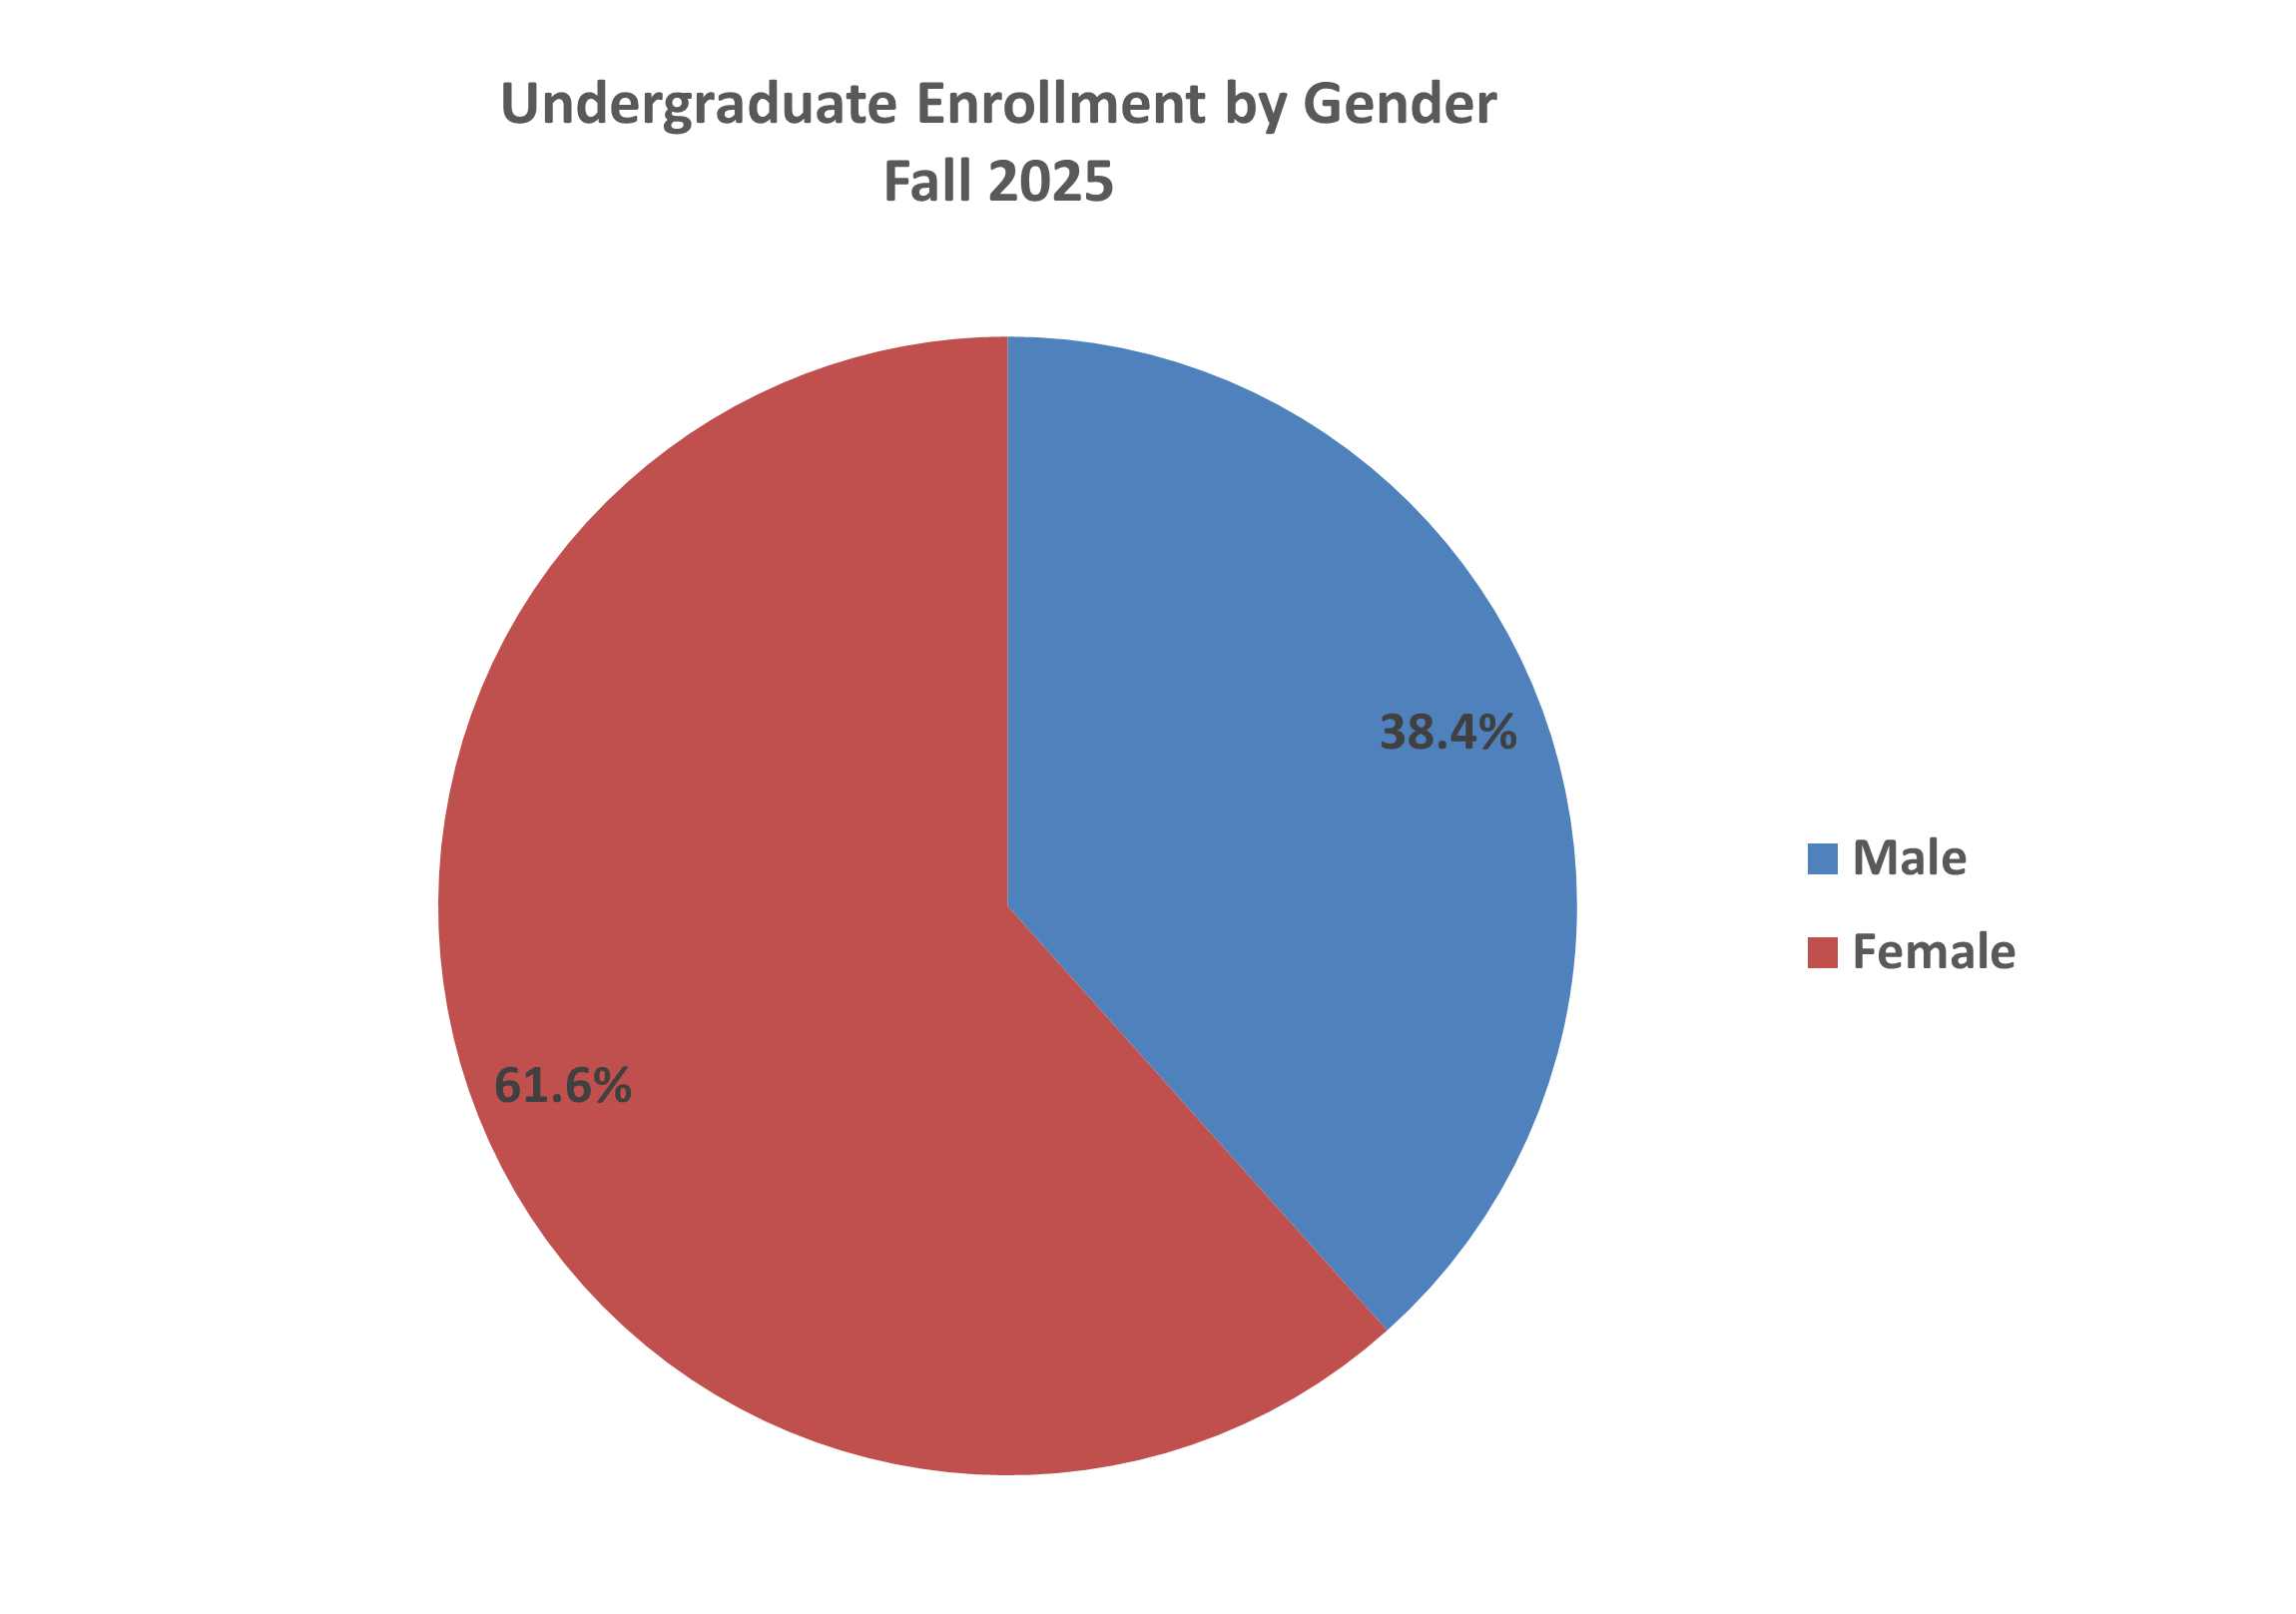
| Total Females | 8,655 | 100.0% | 8,090 | 100.0% | 7,958 | 100.0% | 7,849 | 100.0% | 7,665 | 100.0% | -2.3% |
Male
| Ethnicity | Fall 2021 | Fall 2022 | Fall 2023 | Fall 2024 | Fall 2025 | % change from Previous Year |
|||||
|---|---|---|---|---|---|---|---|---|---|---|---|
| American Indian or Alaska Native | 9 | 0.2% | 7 | 0.1% | 4 | 0.1% | 3 | 0.1% | 1 | 0.0% | -66.7% |
| Asian | 600 | 12.1% | 592 | 12.4% | 561 | 11.4% | 545 | 11.4% | 517 | 10.8% | -5.1% |
| Black or African American | 782 | 15.8% | 704 | 14.8% | 707 | 14.4% | 723 | 15.1% | 744 | 15.6% | 2.9% |
| Hispanic/Latino | 2,534 | 51.1% | 2,533 | 53.1% | 2,701 | 54.9% | 2,669 | 55.9% | 2,677 | 56.1% | 0.3% |
| White | 737 | 14.9% | 651 | 13.7% | 645 | 13.1% | 551 | 11.5% | 500 | 10.5% | -9.3% |
| Native Hawaiian or Other Pacific Islander | 4 | 0.1% | 2 | 0.0% | 6 | 0.1% | 4 | 0.1% | 2 | 0.0% | -50.0% |
| Two or More Races | 120 | 2.4% | 114 | 2.4% | 125 | 2.5% | 117 | 2.5% | 125 | 2.6% | 6.8% |
| International | 140 | 2.8% | 129 | 2.7% | 124 | 2.5% | 110 | 2.3% | 108 | 2.3% | -1.8% |
| Race and ethnicity unknown | 31 | 0.6% | 34 | 0.7% | 49 | 1.0% | 51 | 1.1% | 102 | 2.1% | 100.0% |
| Total Males | 4,957 | 100.0% | 4,766 | 100.0% | 4,922 | 100.0% | 4,773 | 100.0% | 4,776 | 100.0% | 0.1% |
Overall
| Ethnicity | Fall 2021 | Fall 2022 | Fall 2023 | Fall 2024 | Fall 2025 | % change from Previous Year |
|||||
|---|---|---|---|---|---|---|---|---|---|---|---|
| American Indian or Alaska Native | 17 | 0.1% | 13 | 0.1% | 11 | 0.1% | 9 | 0.1% | 7 | 0.1% | -22.2% |
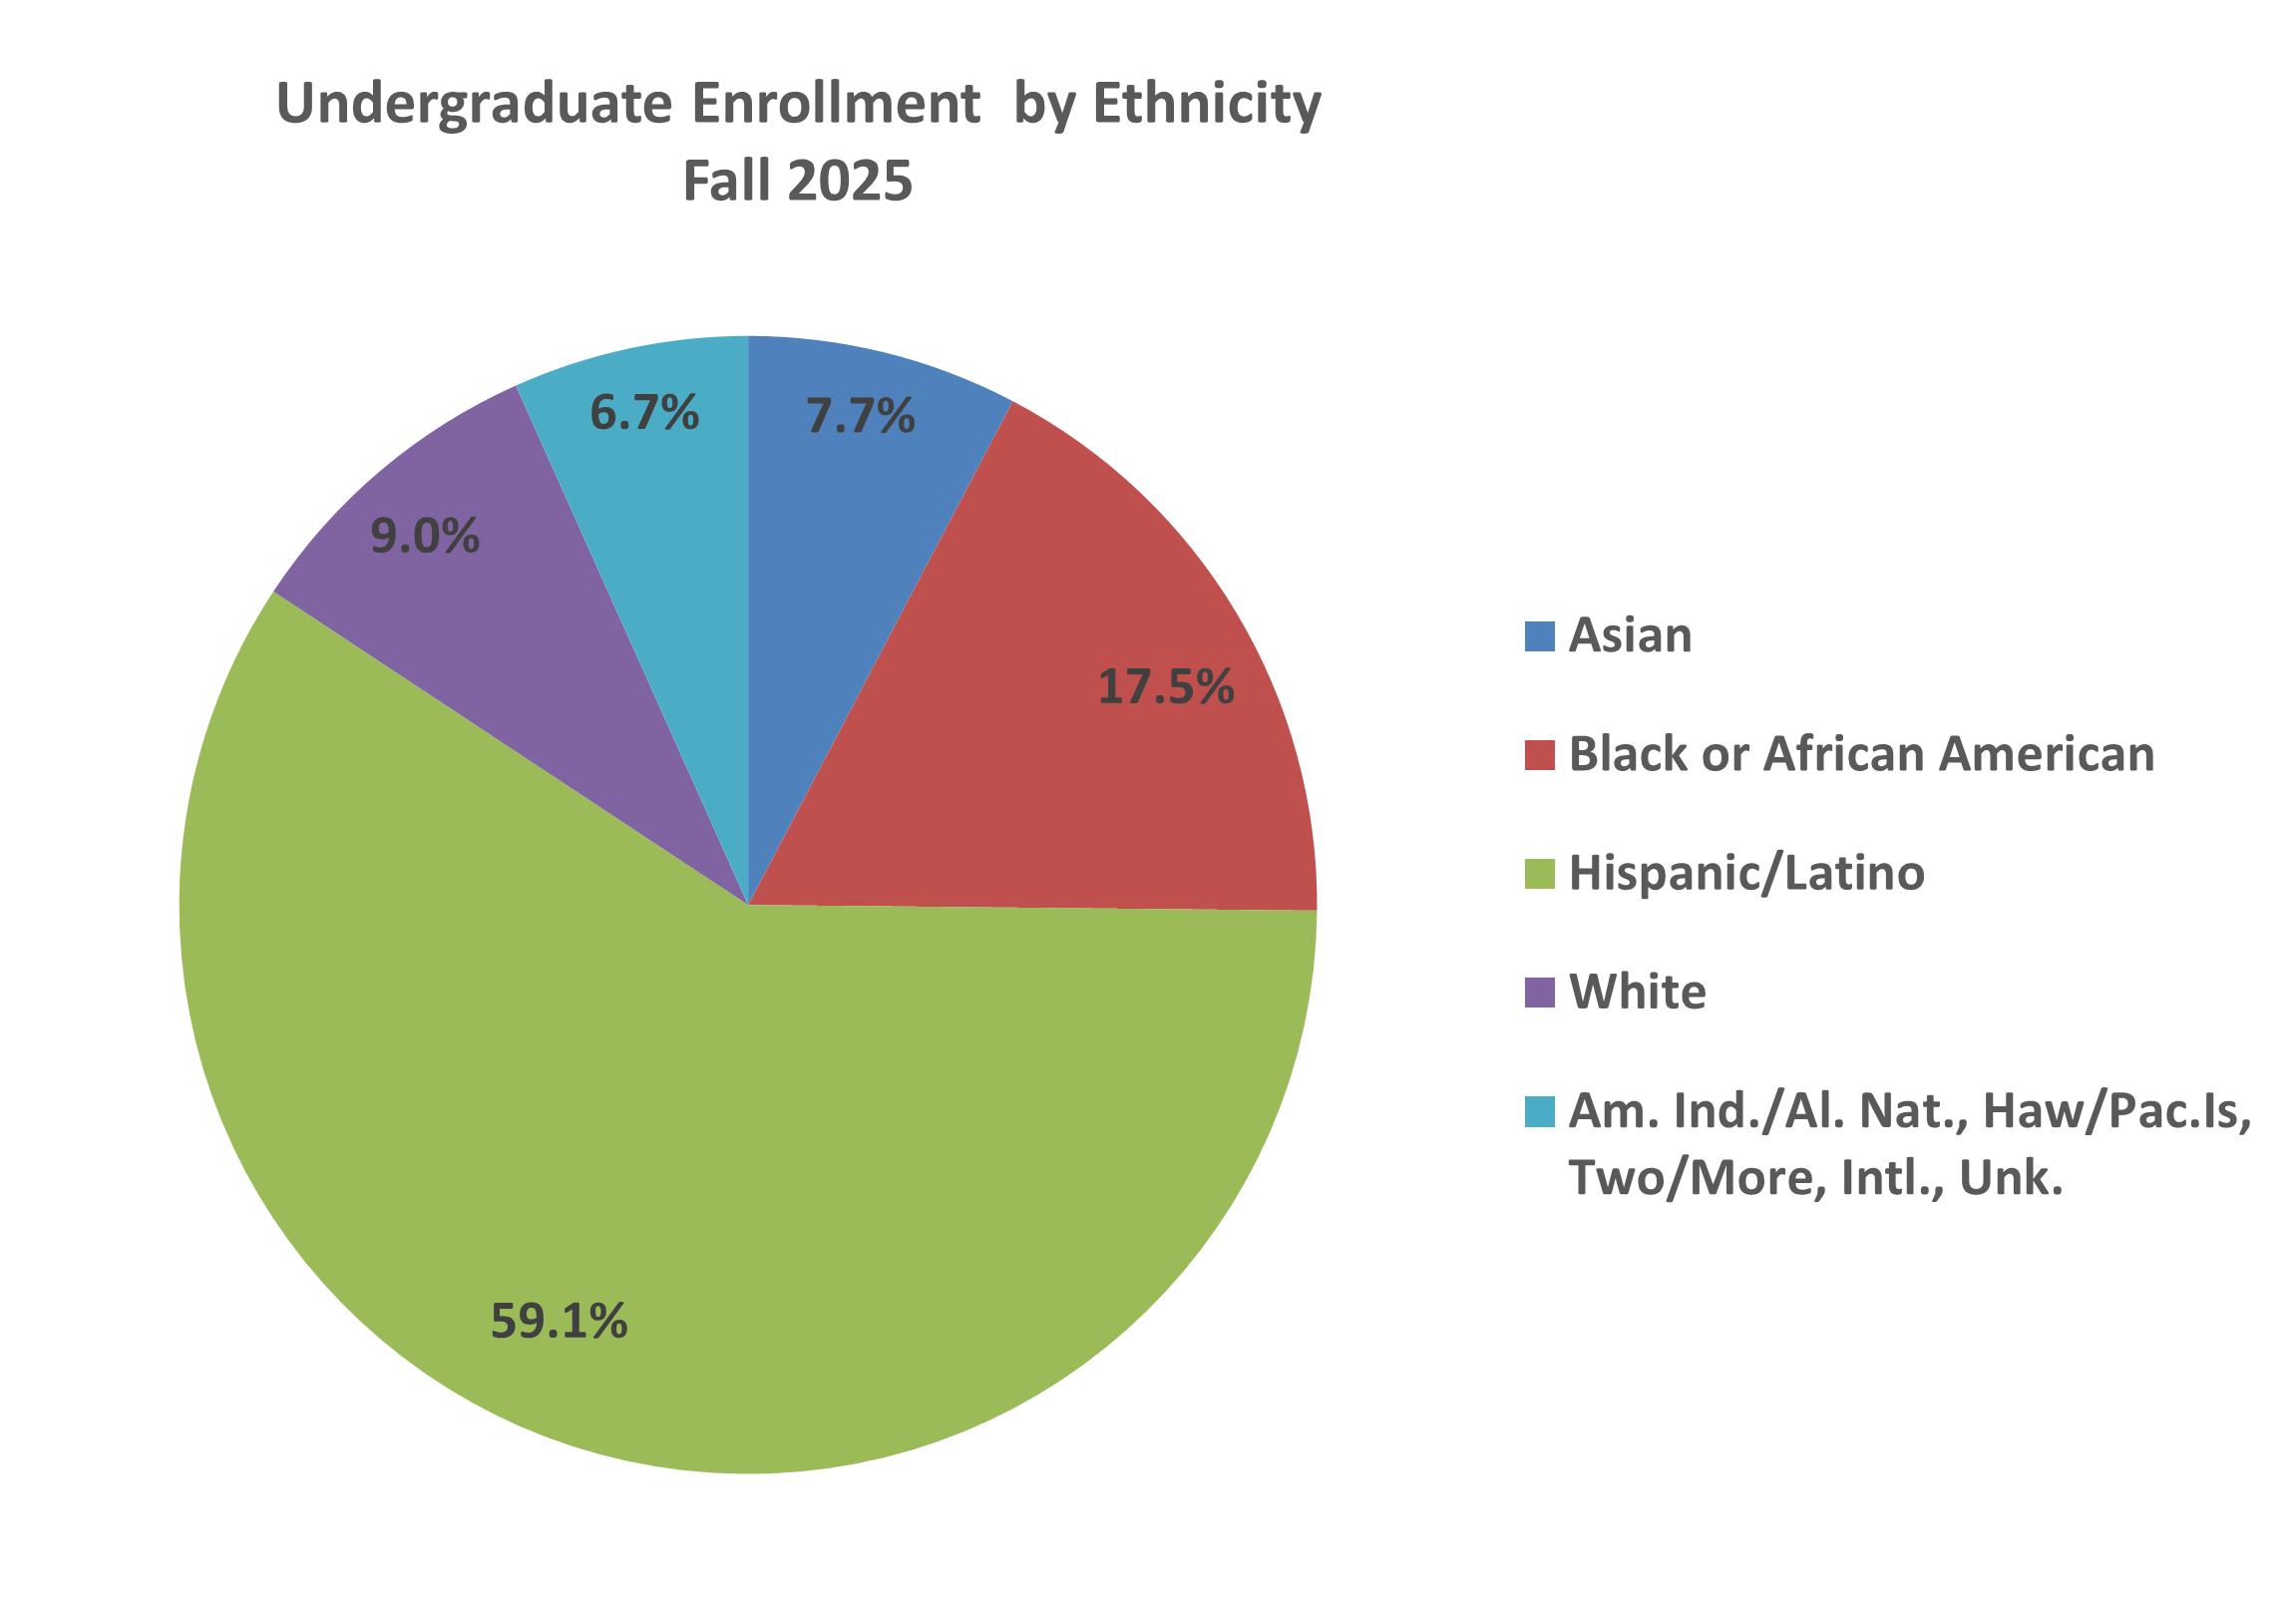
| Asian | 1,123 | 8.3% | 1,091 | 8.5% | 1,064 | 8.3% | 1,035 | 8.2% | 958 | 7.7% | -7.4% |
| Black or African American | 2,492 | 18.3% | 2,244 | 17.5% | 2,176 | 16.9% | 2,174 | 17.2% | 2,172 | 17.5% | -0.1% |
| Hispanic/Latino | 7,588 | 55.7% | 7,378 | 57.4% | 7,528 | 58.4% | 7,483 | 59.3% | 7,356 | 59.1% | -1.7% |
| White | 1,682 | 12.4% | 1,473 | 11.5% | 1,422 | 11.0% | 1,257 | 10.0% | 1,122 | 9.0% | -10.7% |
| Native Hawaiian or Other Pacific Islander | 6 | 0.0% | 7 | 0.1% | 12 | 0.1% | 14 | 0.1% | 10 | 0.1% | -28.6% |
| Two or More Races | 337 | 2.5% | 298 | 2.3% | 312 | 2.4% | 296 | 2.3% | 310 | 2.5% | 4.7% |
| International | 291 | 2.1% | 276 | 2.1% | 244 | 1.9% | 227 | 1.8% | 229 | 1.8% | 0.9% |
| Race and ethnicity unknown | 76 | 0.6% | 76 | 0.6% | 111 | 0.9% | 127 | 1.0% | 277 | 2.2% | 118.1% |
| Grand Total | 13,612 | 100.0% | 12,856 | 100.0% | 12,880 | 100.0% | 12,622 | 100.0% | 12,441 | 100.0% | -1.4% |
Sources: CBM001, CBM0C1